Features
Here’s what makes PSVTracker™ a smarter way to track and understand your investments.
Bank-Level Security - Your data is encrypted in transit and at rest on AWS using modern security standards. Even if someone gained access to the underlying data, it would remain unreadable.
Anonymous Storage - Your personal identity is stored separately from your financial data. This added separation helps protect against breaches, targeted marketing, and identity exposure.
Bank and Brokerage Connections - Securely connect bank and brokerage accounts to automatically sync transactions and balances. PSVTracker uses trusted financial integrations so your credentials are never stored or visible to us.
Unlimited Imports - Import as much data as you need from Excel or CSV files. PSVTracker removes the limits and headaches of managing complex portfolios in spreadsheets.
Real-Time Calculations - Every update automatically refreshes totals, valuations, and performance metrics so your portfolio always reflects the latest data.
Comprehensive Investment Metrics - PSVTracker automatically calculates XIRR, Cash on Cash (CoC), Equity Multiple, CAGR, Total Returns, Cost Basis, and Market Value so you can fully understand investment performance.
Portfolio Diversification Insights - Organize investments by asset class, entity, or sponsor to understand diversification and identify areas of concentration.
Interactive Charts and Graphs - Transform your data into clear visual insights. Analyze performance across time, asset class, account, or sponsor to quickly identify trends and patterns.
Geographic Exposure - Visualize where your capital is deployed across cities, regions, and markets to better understand geographic concentration and opportunity.
AI Portfolio Insights - Identify trends, risks, and performance drivers across your investments with intelligent analysis designed to support better decision making.
-

Portfolio
All Your Investments. One Secure Hub.
Manage your entire portfolio in one place and stay on top of how your investments are really performing.Portfolio Oversight – Track performance by account, entity, and sponsor for a complete view of your holdings.
Powerful Metrics – Monitor Expected IRR, Cash-on-Cash, Equity Multiple, and other proforma data to keep expectations aligned with reality.
Detailed Holdings – Dive into IRRs, cost basis, and market value for every investment.
Flexible Management – Edit asset classes easily, set investment status to Active or Closed, and hide closed positions for a cleaner view.
Document Tracking – Stay organized by marking K-1s as received or pending, and link directly to your cloud drive for related documents.
Sponsor Notes – Save key information about sponsors and operators right inside the platform.
Full Control – Export and/or delete an investment and all underlying transactions if needed.
And there’s more on the horizon—ask us about our roadmap for Risk & Location insights to take your portfolio tracking even further.
-
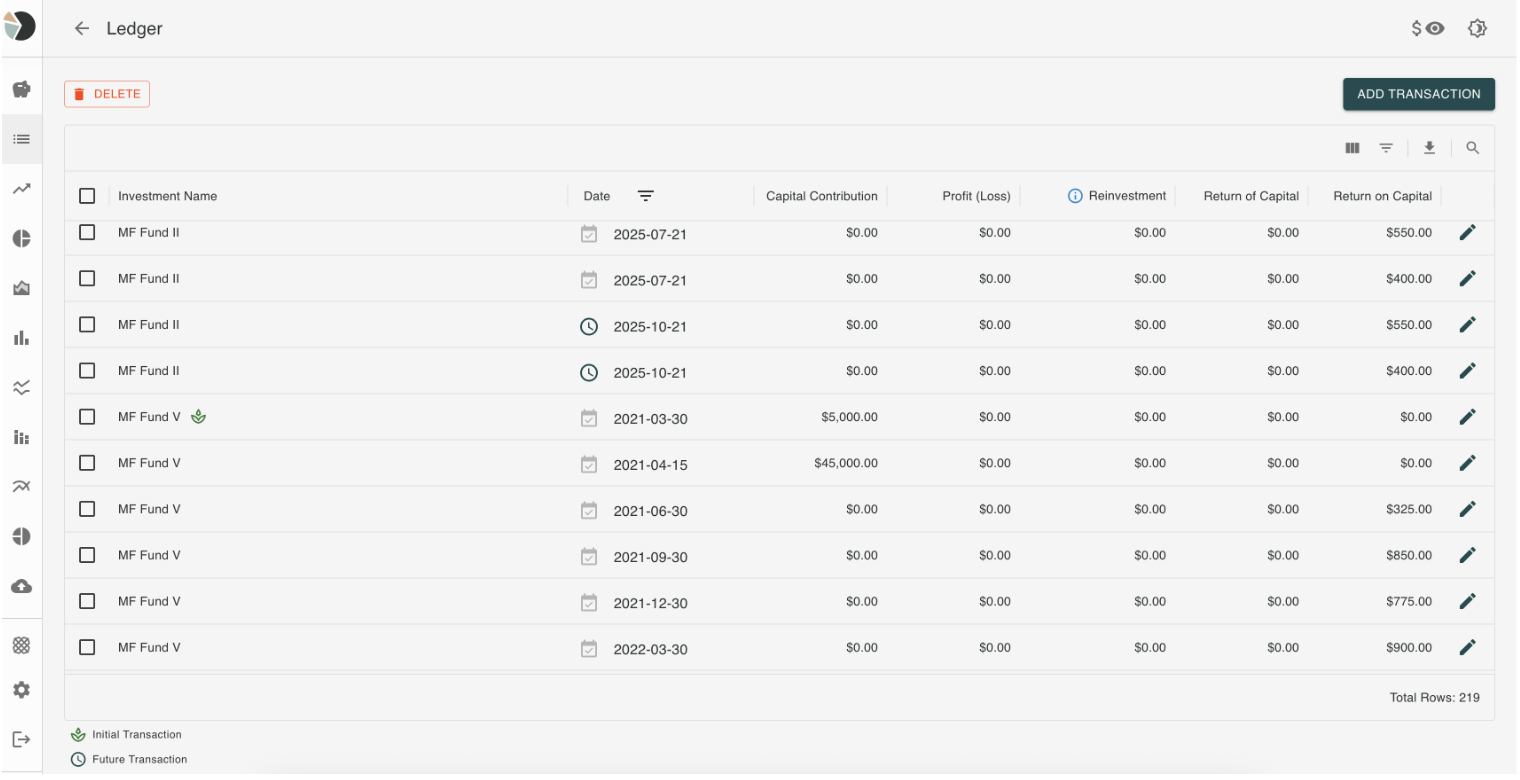
Ledger
Easy Imports & Updates
Import your ledger directly from CSV or Excel files, or add and update transactions on the fly—no heavy lifting required.Comprehensive Tracking
Stay on top of every key transaction type: Capital Contributions, Profit & Loss, Reinvestments, Return of Capital, and Return on Capital.Intuitive Organization
Distinguish initial contributions from future transactions. Sort and filter by date, investment name, or amount to quickly find what you need.Full Transaction Control
Add, edit, or delete transactions with ease. Each save automatically recalculates totals, so your data is always accurate and up to date.Instant Insights
Every update triggers fresh calculations of total returns and current values, giving you real-time visibility into portfolio performance. -

Performance
Where the Insights Come to Life
Finally—metrics and analytics that actually help you decide your next move with confidence.Portfolio Weights – See allocations by asset class, account, or sponsor, then drill down to individual investments for a full breakdown.
Powerful Metrics – Access detailed calculations for XIRR, Cash-on-Cash (CoC), Equity Multiple (EM), Statement Value, and Total Return—at both the investment and portfolio level.
Expected vs. Actual – Compare how each investment or asset class is performing against your original IRR, CoC, and EM projections.
Returns Over Time – Track cash flows for Return of Capital, Return on Capital, or both—visualized so you can clearly see trends at a glance.
Investment Details – View expected vs. actual results across the full life of each investment, from your initial contribution through to closeout.
Net Cashflow – Follow the money in and out—capital contributions, distributions, and profits—to understand your performance over time.
Equity Holdings – Instantly see your exposure across equities. PSVTracker crunches the numbers so you always know where you stand.